INFINITY
TRADES

We offer a straightforward and effective trading strategy that can help you earn consistent profits while avoiding feeling overwhelmed. We look forward to trading with you!
Talk to us
+260961365076
+260972539959
INFINITY TRADES


About us
We are a team of profesional traders whos main objective is to execute with precission and accuracy thus making consistent profits automatic
We understand the importance of having a well-defined strategy and we work hard to ensure that every trade we make is carefully planned out. Our team is made up of experts in various markets and we utilize a combination of technical and fundamental analysis to make informed decisions.
We believe that communication is key and we make sure to keep our clients informed throughout the trading process. We provide regular updates on market conditions and our progress, so that our clients are always in the loop.
At the end of the day, our goal is to help our clients achieve their financial objectives. We take great pride in our work and we are committed to delivering results that exceed expectations. If you're looking for a team of dedicated professionals who can help you achieve your financial goals, look no further than us.
INTRODUCTION
Trading is one of the most profitable activities on the Internet. Every day, billions are earned and lost at the click of a mouse by people who trade online. As a trader, you trade in financial instruments such as stocks, currency pairs, and index funds.Financial trading is no different to any other form of trading: it’s about buying and selling assets with the aim of making a profit
What Are Financial Markets?
The financial market is the marketplace where different financial assets such as bonds, shares, commodities, currencies, derivatives, etc., are traded.
It is a virtual marketplace that is accessible to anyone who can access the internet.
What are financial assets?
The are also called financial instruments or securities. A financial asset is a non-physical asset whose value is derived from a contractual claim, such as bank deposits, bonds, and participations in companies' share capital. Just like any marketplace, financial markets involve the buying and selling of these assets. Below are examples of assets that exist in the trading world.
- Currencies:
- Currencies are the most commonly traded asset class in the forex market. These include major global currencies such as the US dollar (USD), the euro (EUR), the British pound (GBP), the Japanese yen (JPY), and the Swiss franc (CHF), among others.
- Currencies are traded in pairs, where the value of one currency is determined by its relationship to another. For example, the EUR/USD pair represents the value of the euro in terms of the US dollar1.
- Commodities:
- Commodities are another significant asset class in forex trading. These are physical goods traded on the market. Examples include gold, oil, and various agricultural products.
- Commodity prices are influenced by supply and demand forces, and they can fluctuate based on market conditions1.
- Stock Indices:
- Stock indices represent the performance of a group of stocks. Examples include the S&P 500 or the NASDAQ.
- Traders use stock indices to get a broad view of the market and take advantage of movements in a large number of stocks1.
- Key Considerations when trading assets:
- Liquidity: The ability to buy or sell an asset quickly and easily. Liquidity is crucial in the forex market to avoid significant slippage or price impact.
- Volatility: A measure of price fluctuations. High volatility can lead to greater potential returns but also higher risks.
- Spread: The difference between the bid and ask prices of an asset. In forex, it’s the difference between the buying (ask) and selling (bid) prices of a currency pair1.
Remember, successful forex trading involves understanding these asset classes, managing risk, and making informed decisions based on market conditions. Happy trading! 📊💱
Learn more
Types of traders
There are various types of traders in financial markets, including
- Day traders who buy and sell shares within a single trading day,.
- Swing traders who hold positions for several days to weeks.
- Position traders who take longer-term positions based on fundamental analysis
- Scalpers who aim to profit from small price changes,.
- Algorithmic traders who use computer algorithms to execute trades based on predefined rules.
- High-frequency traders who profit from small price discrepancies.
- Trend followers who aim to identify and profit from long-term price trends.
- Contrarian traders who take positions against the crowd.
- Event-driven traders who focus on specific events.
- Retail traders who participate in financial markets with their own funds. These categories are not mutually exclusive, and traders may use a combination of strategies based on market conditions and personal preferences.
Terminologies
Trading involves numerous terminologies that are commonly used. Here are some of the key terms that traders should keep in mind:
- Broker: An individual or firm that executes buy and sell orders on behalf of investors in exchange for a commission or fee.
- Bull Market: A market characterized by rising prices and optimism among investors, leading to increased buying activity.
- Bear Market: A market characterized by falling prices and pessimism among investors, leading to increased selling activity.
- Long Position: When an investor buys a security with the expectation that its price will rise. In a long position, the investor profits from an increase in the security's price.
- Short Position: When an investor sells a security they don't own, with the expectation that its price will decline. In a short position, the investor profits from a decrease in the security's price.
- Bid Price: The highest price at which a buyer is willing to purchase a security.
- Ask Price: The lowest price at which a seller is willing to sell a security.
- Spread: The difference between the bid price and the ask price. It represents the transaction cost associated with buying or selling a security.
- Volume: The number of shares or contracts traded in a security during a given period of time. High volume often indicates increased liquidity and interest in a security.
- Market Order: An order to buy or sell a security at the best available price in the market.
- Limit Order: An order to buy or sell a security at a specified price or better. It ensures that the trade is executed only at the desired price or a more favorable price.
- Stop Order: An order to buy or sell a security when it reaches a specified price, known as the stop price. It is used to limit losses or protect profits.
- Margin: Borrowed funds used to leverage trading positions. Margin allows traders to control larger positions with a smaller amount of capital, but it also increases the risk.
- Day Trading: The practice of buying and selling securities within the same trading day, with no positions held overnight.
- Volatility: The measure of the price fluctuation of a security or market. High volatility indicates larger price swings and potential for higher profits or losses.
- Dividend: A portion of a company's earnings distributed to its shareholders on a per-share basis.
While these are just a few examples, there are many more trading terminologies depending on the specific asset class (stocks, Forex, bonds, options, futures, etc.) and trading strategies.
Types of market orders
When it comes to trading there are different ways in which you execute your trades (buying and selling financial instruments) Below is a list of the types of market orders ;
- Instant execution refers to an immediate execution of a trade at the current market price. This feature allows traders to capitalize on market opportunities without delay, as trades are executed without any intervention or confirmation from the trader. If the traders decides to buy or sell that orders is placed immediately the button is clicked
- Limit order A limit order instructs a broker to buy or sell an instrument at the specified price or better, however there is not guarantee that the order will be filled. Limit orders enable you to state exactly how much you are willing to buy or sell an instrument for.Buy limit orders mean placing a trade at or below a defined price. Likewise, sell limit orders mean executing a trade at or above a defined price.
- Stop OrderA stop order is used to enter the market at a less favourable price. In the case of a buy-stop order, the order is placed above the current market price and in the case of a sell order it is placed below the current market price.
- A Stop Limit Order is a type of trading order that consists of two components: a stop price and a limit price. The stop price acts as a trigger, activating the order once the market price reaches the specified level. Once the stop price is triggered, the order becomes a limit order that executes at the limit price or better. This order type enables traders to control the price at which they enter or exit a position while managing the risk of adverse price movements. This type of order gives the trader some protection from a fill much worse than the stop price in a gapping or illiquid market
- A trailing stop is a modification of a typical stop order that can be set at a defined percentage or dollar amount away from a security's current market price. For a long position, an investor places a trailing stop loss below the current market price. For a short position, an investor places the trailing stop above the current market price.
Here's a list of critical components to consider in trading:
- Fundamental analysis
- Technical analysis
- Risk management
- Trading plan
- Entry and exit strategy
- Trading psychology
Fundamental Analysis.
Fundamental Analysis involves studying the impact of global economic events on assest trends. This analysis requires a deep understanding of economic and financial factors such as interest rates, inflation, and political stability. Analysts keep track of news and events, as well as economic indicators to gain insight into likely currency price trends. It provides a longer-term perspective on the market compared to other analysis types. However, it's not a guaranteed way to make profits due to unpredictable market changes.
What is economic calendar?
An economic calendar is created by economists to predict upcoming economic figures and values based on previous months. It includes the date, time, currency, data released, actual figures, forecast figures, and previous figures.
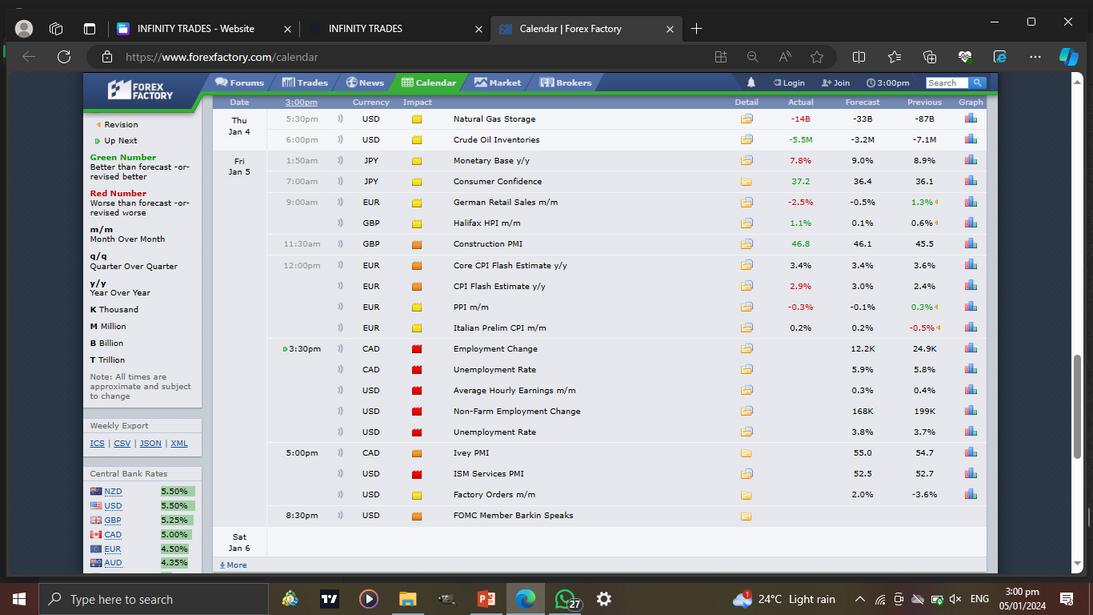
Traders usually expect the US dollar to strengthen against other currencies if the forecast is better than the previous figure. However, they need to check the actual data when news is due. Rising oil prices can weaken currencies for countries that heavily import oil, such as America and Japan.Good examples of detailed economic calendars:
Forex Economic Calendar @ Myfxbook
Forex Economic Calendar @ ForexFactory
Forex Economic Calendar @ FXSteet
Forex Economic Calendar @ BabyPips
Whose speeches to keep an eye on?
The market is influenced by several factors including:
Interest rates, where a country raising interest rates strengthens its currency, and employment situations, where weak economic activity and lower interest rates can have a negative impact on currency.
The trade balance, budget, and treasury budget are all important indicators of a country's economic health. If a country experiences significant trade balance deficits, its currency will likely be weak due to frequent commercial sell-offs. Gross Domestic Product (GDP) is a crucial metric reported quarterly that provides a primary indication of economic activity strength. A high GDP figure often leads to expectations of higher interest rates, which can positively impact the currency. However, Forex brokers may not be supportive of traders during news announcements, as they may freeze trading platforms to prevent opening or closing of trades
Less powefull economic indicators are:
Retail sales It is the first real indicator of the strength of consumer expenditure. Durable goods Rising Durable Goods Orders are normally associated with stronger economic activity and can therefore lead to higher short-term interest rates, which is usually supportive for a currency.
Technical analysis
Technical analysis is a method that traders use to identify investment opportunities by analyzing trading activity and price fluctuations to uncover trends and patterns in market charts. It can be applied to any security with historical trading data, including stocks, futures, commodities, fixed-income, currencies, and other securities. Technical analysis forecasts the price movement of tradable instruments and some analysts track trading volume or open interest figures. It is usually used in conjunction with other forms of research by professional analysts.
Technical Analysis Indicators
Across the industry, there are hundreds of patterns and signals that have been developed by researchers to support technical analysis trading. Technical analysts have also developed numerous types of trading systems to help them forecast and trade on price movements.
Some indicators are focused primarily on identifying the current market trend, including support and resistance areas, while others are focused on determining the strength of a trend and the likelihood of its continuation. Commonly used technical indicators and charting patterns include trendlines, channels, moving averages, and momentum indicators.
In general, technical analysts look at the following broad types of indicators:
- Price trends
- Chart patterns
- Volume and momentum indicators
- Oscillators
- Moving averages
- Support and resistance levels
Price trends in technical analyisis
Price trends are crucial in technical analysis. Traders and investors use tools like trendlines and support and resistance levels to identify patterns in price movements and predict future price movements. Technical analysis is just one of many tools available for making investment decisions, and price trends can be influenced by various factors. Understanding price trends can increase the chances of success but should be used in conjunction with other forms of analysis. No method of analysis can guarantee success in the financial markets.
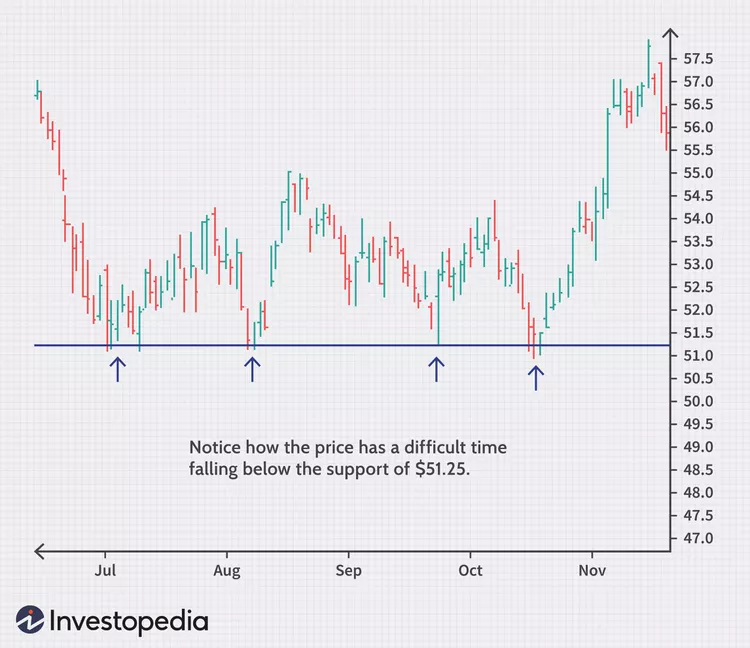
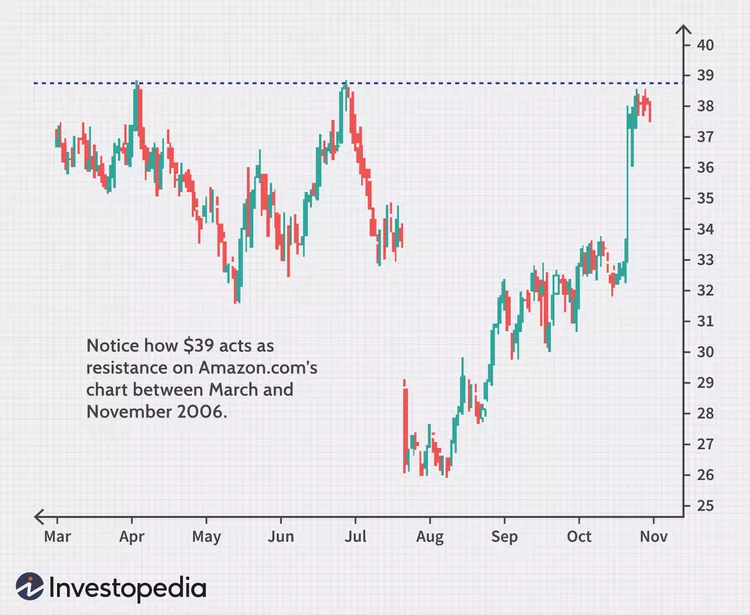
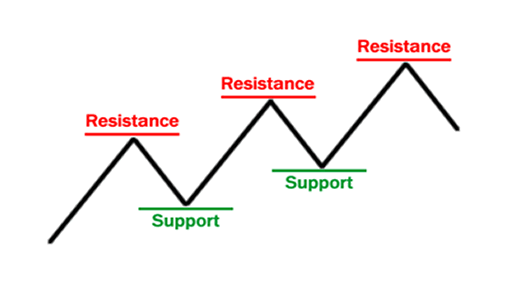
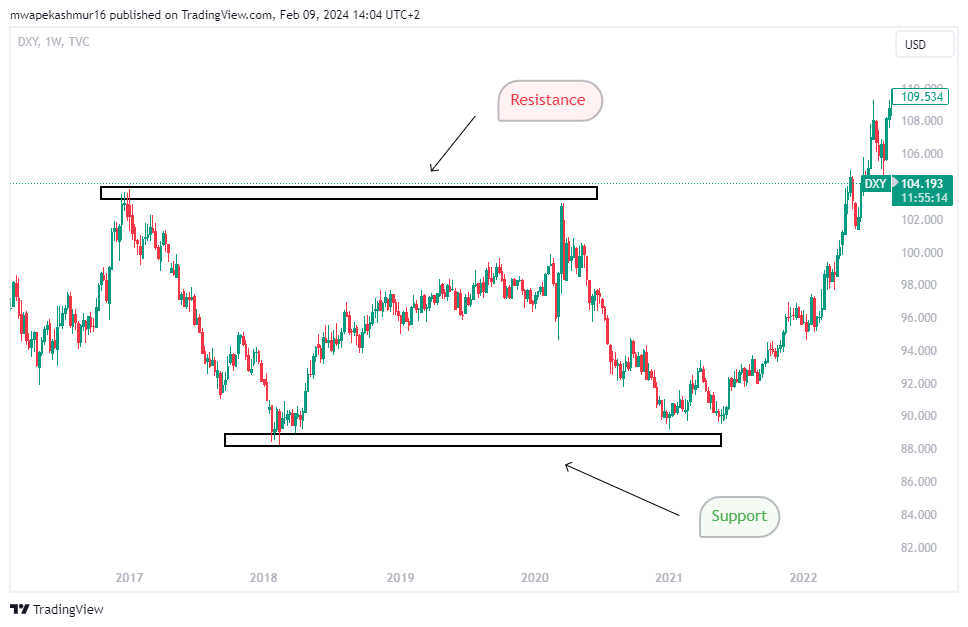
support and resistance
Support and resistance levels are crucial concepts in technical analysis used by traders to make decisions about buying and selling assets. Support refers to a price level at which demand is strong enough to prevent price from falling further, while resistance is a price level at which supply is strong enough to prevent price from rising further. Identifying these levels can help traders determine potential entry and exit points for trades. Indicators and chart patterns can also be used to confirm support and resistance levels, enabling traders to make more informed decisions. Understanding support and resistance is a valuable tool for traders navigating the markets.
Trendline
A trend line is a diagonal line in finance that bounds the price movement of a security. It is drawn between a minimum of three price pivot points and is used to determine when to enter or exit a trade.
A support trend line is formed when a securities price decreases and then rebounds at a pivot point that aligns with at least two previous support pivot points. Similarly a resistance trend line is formed when a securities price increases and then rebounds at a pivot point that aligns with at least two previous resistance pivot points
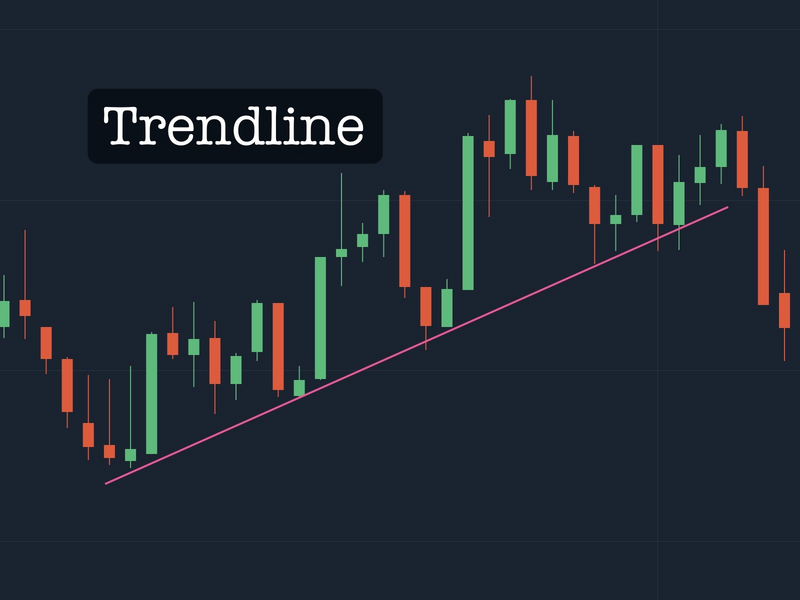
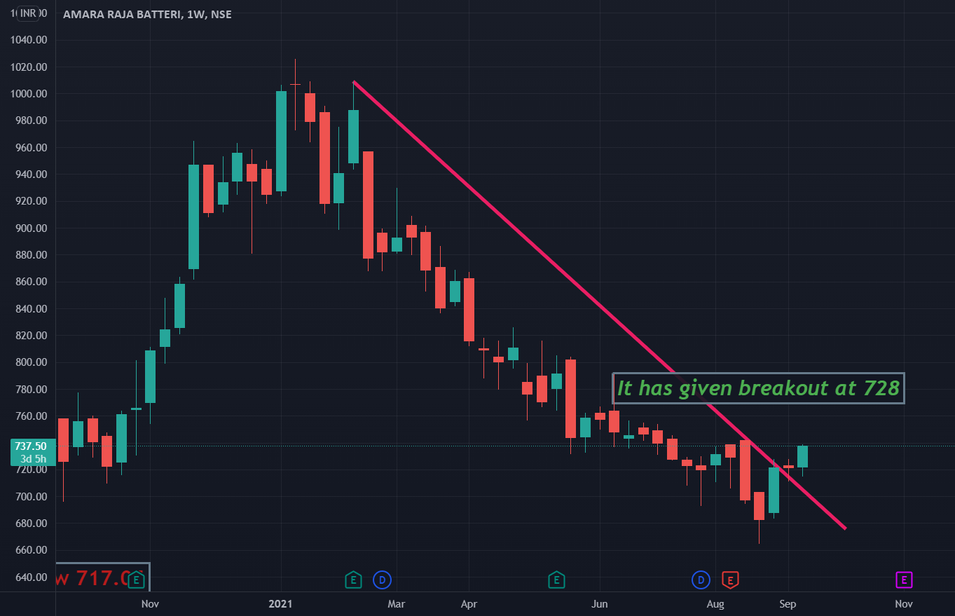
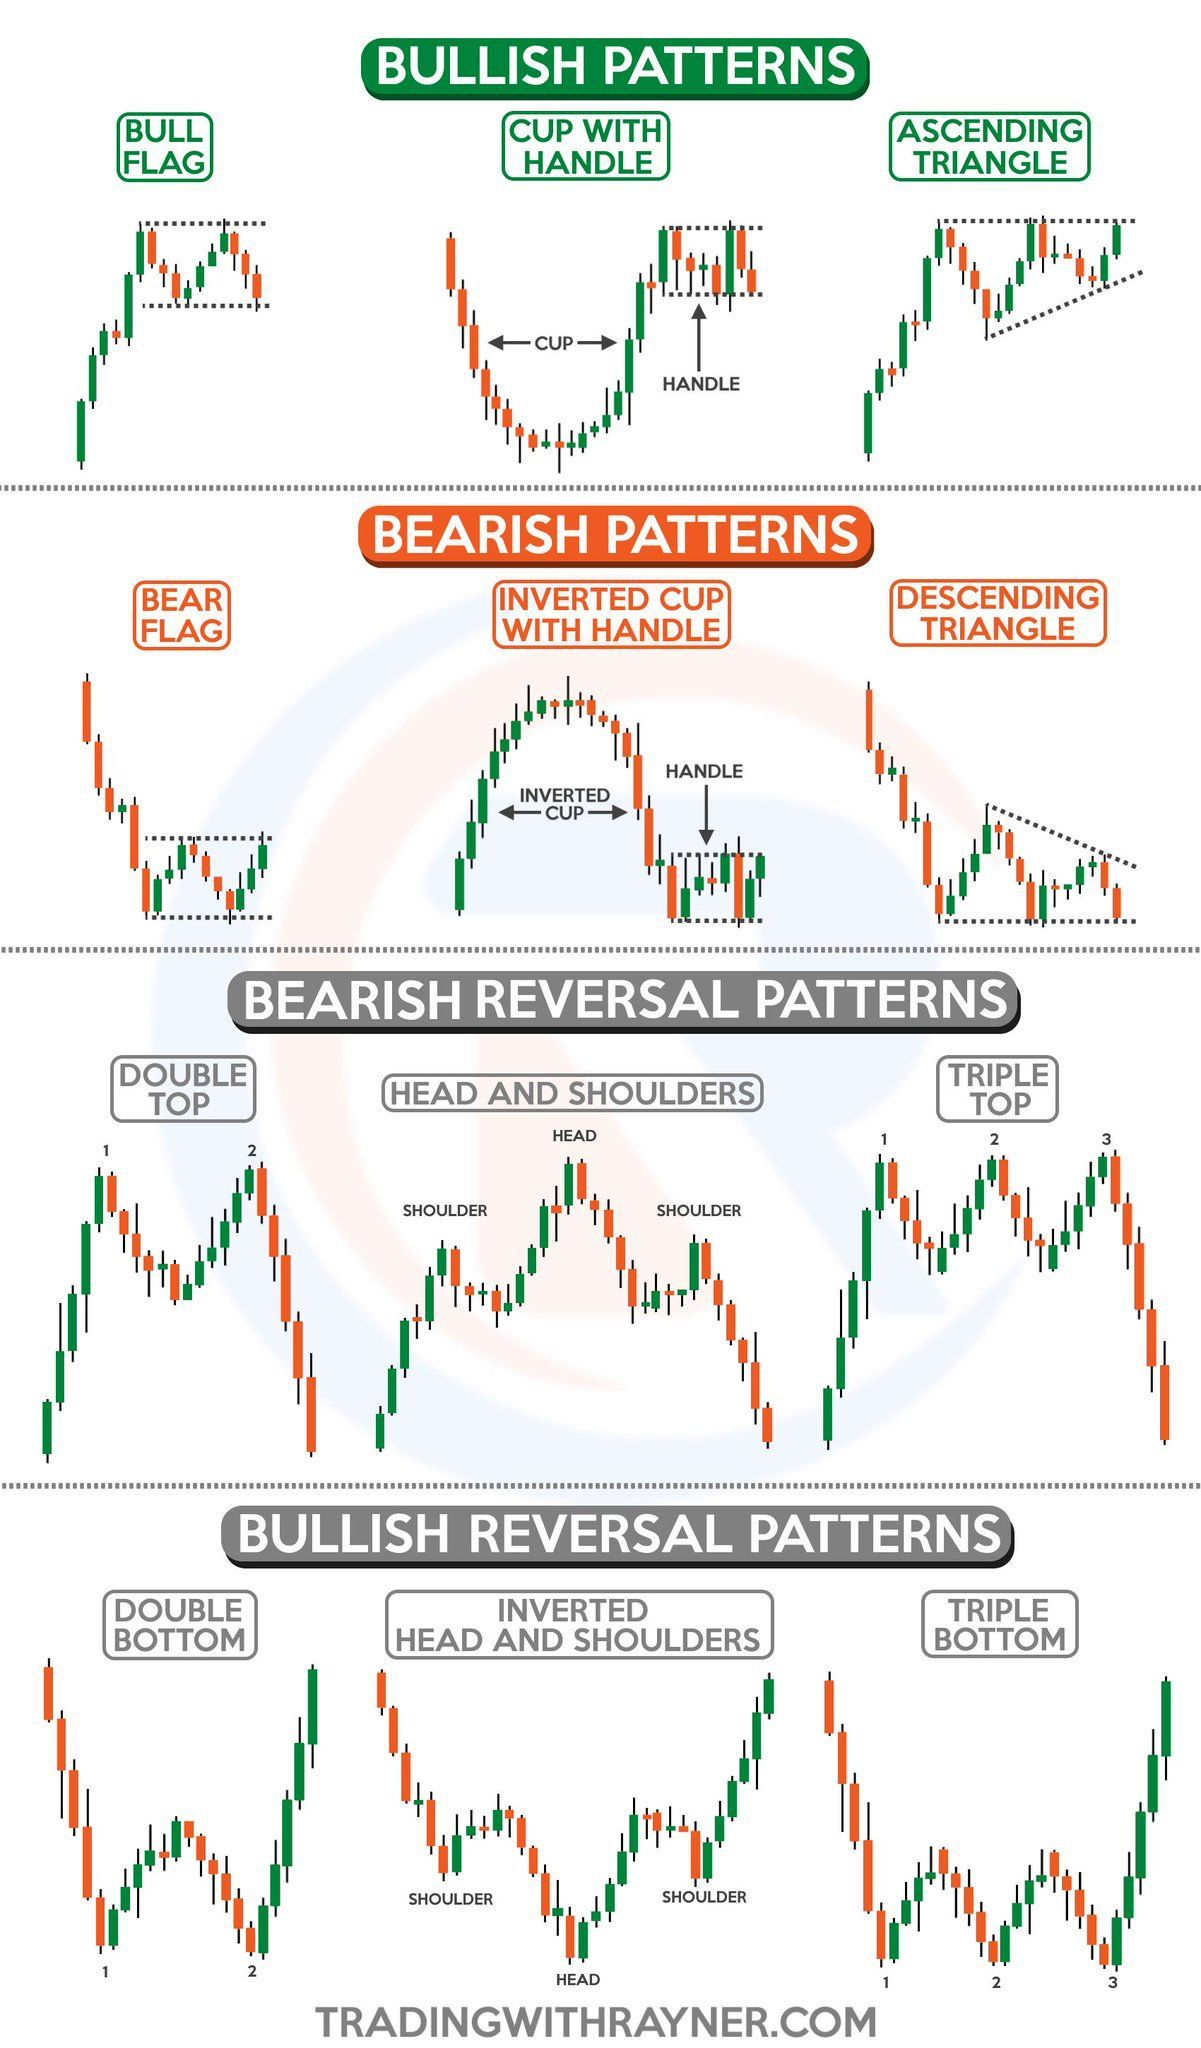
Chart Patterns.
Forex chart patterns are reliable sequences that repeat throughout the forex chart and predict price movement.
They belong to three groups: traditional, candlestick, and harmonic patterns. Candlestick patterns are the most popular.
Chart patterns fall into three categories: reversal, continuation, and bilateral, with bilateral patterns requiring more attention and experience. Thomas Bulkowski's "Encyclopedia of Chart Patterns" offers a comprehensive overview.
Here are some examples;
You can click the following websites you to find out more about chart pattens
Market Structure
Forex market structure refers to the price action that indicates the dominant bullish(upward) or bearish(downward) bias of the market
.TYPES OF MARKET STRUCTURES
- A bullish structure, Is characterized bY higher highs (HH) and higher lows (HL), showing uptrend momentum.
- A bearish structure is characterized by lower highs ( LH) and lower lows (LL), indicating a lack of buying pressure.
- Directionless market. It is also called a choppy market or a sideways market. It is characterizes by price making equal highs and equal lows
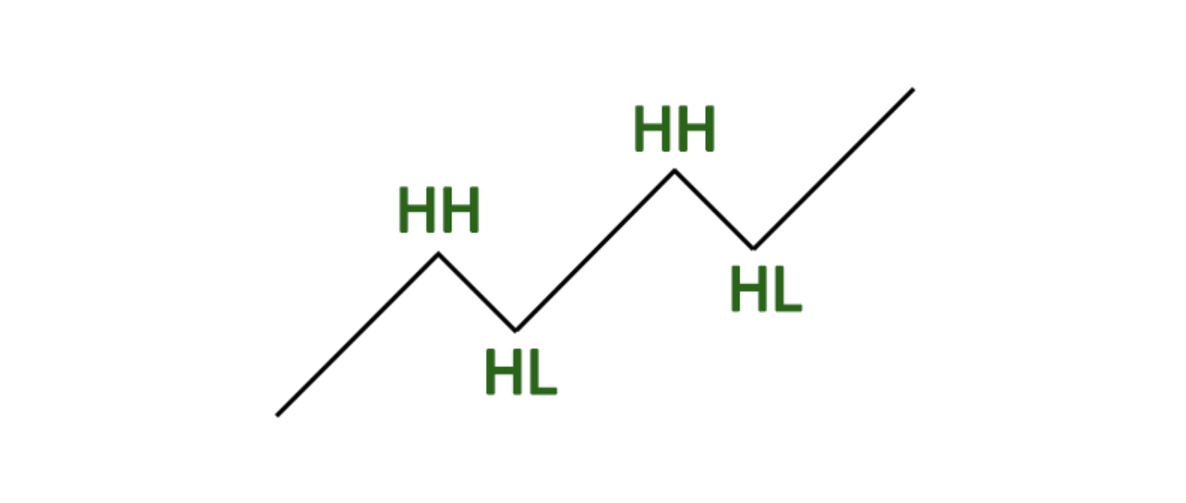
A bullish structure
A bullish market structure in Forex trading is characterized by a strong upward trend, high trading volumes, positive economic indicators, and an optimistic outlook from investors.
The market is seen to be heading towards higher prices., this indicates the presence of more buyers than sellers in the market .
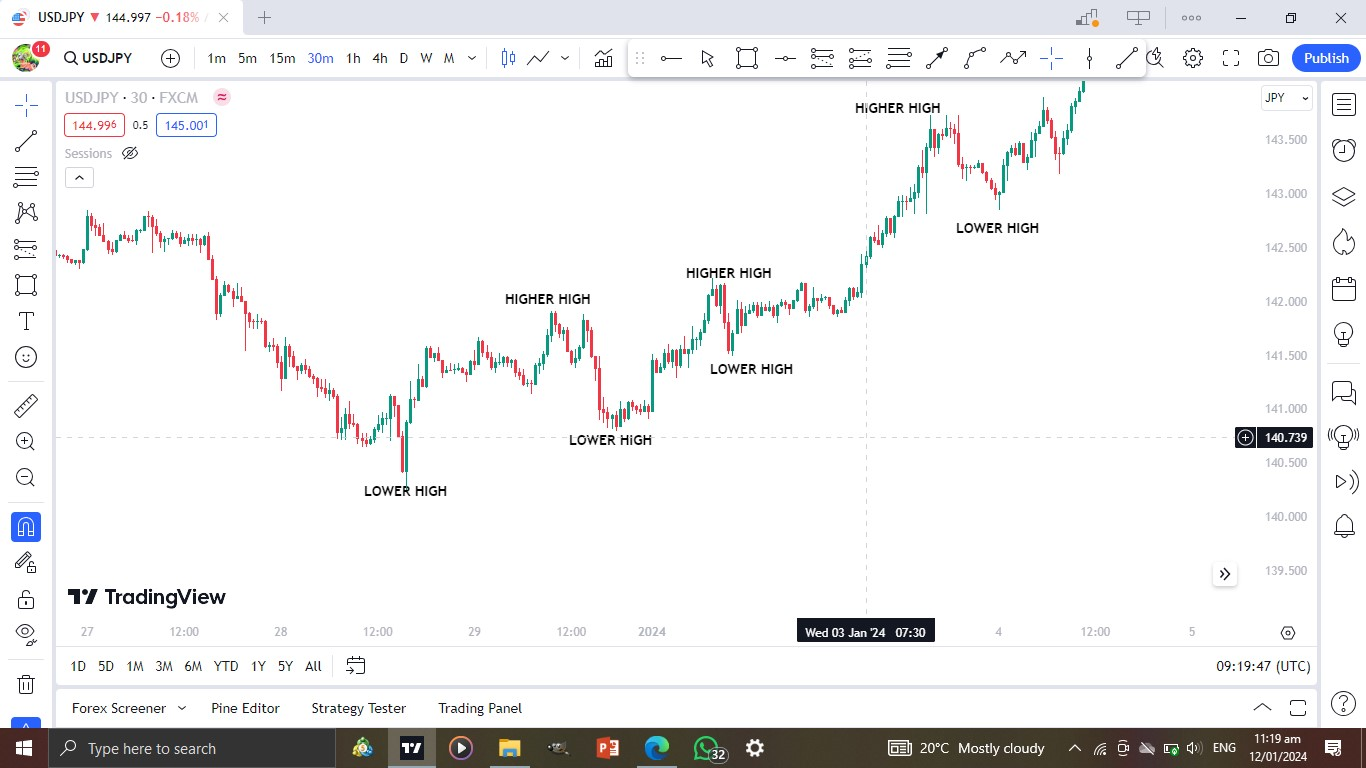
USD/JPY. 1HR Time Frame
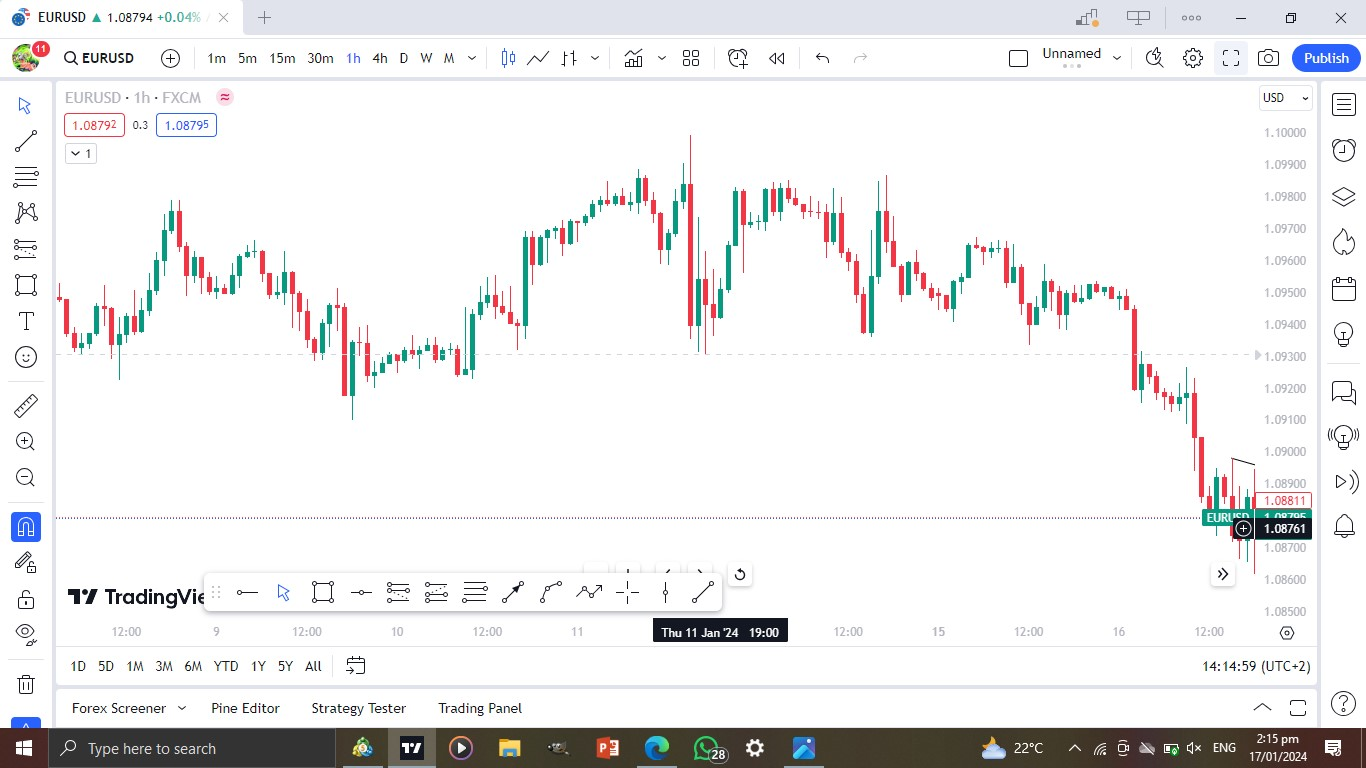
A bearish market structure in Forex is marked by a downtrend where selling pressure dominates the market. It is characterized by lower highs and lower lows. Indicators such as price action patterns, moving averages, and trendlines can help identify a bearish market structure.
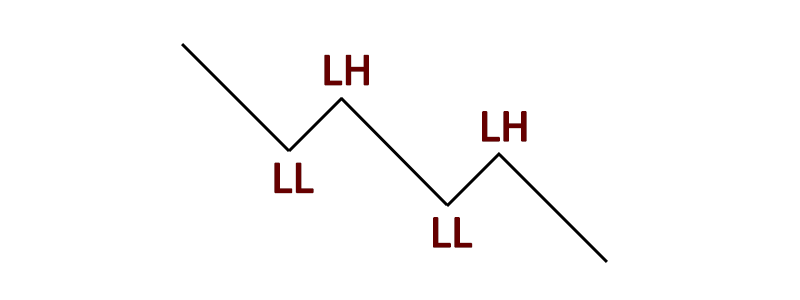
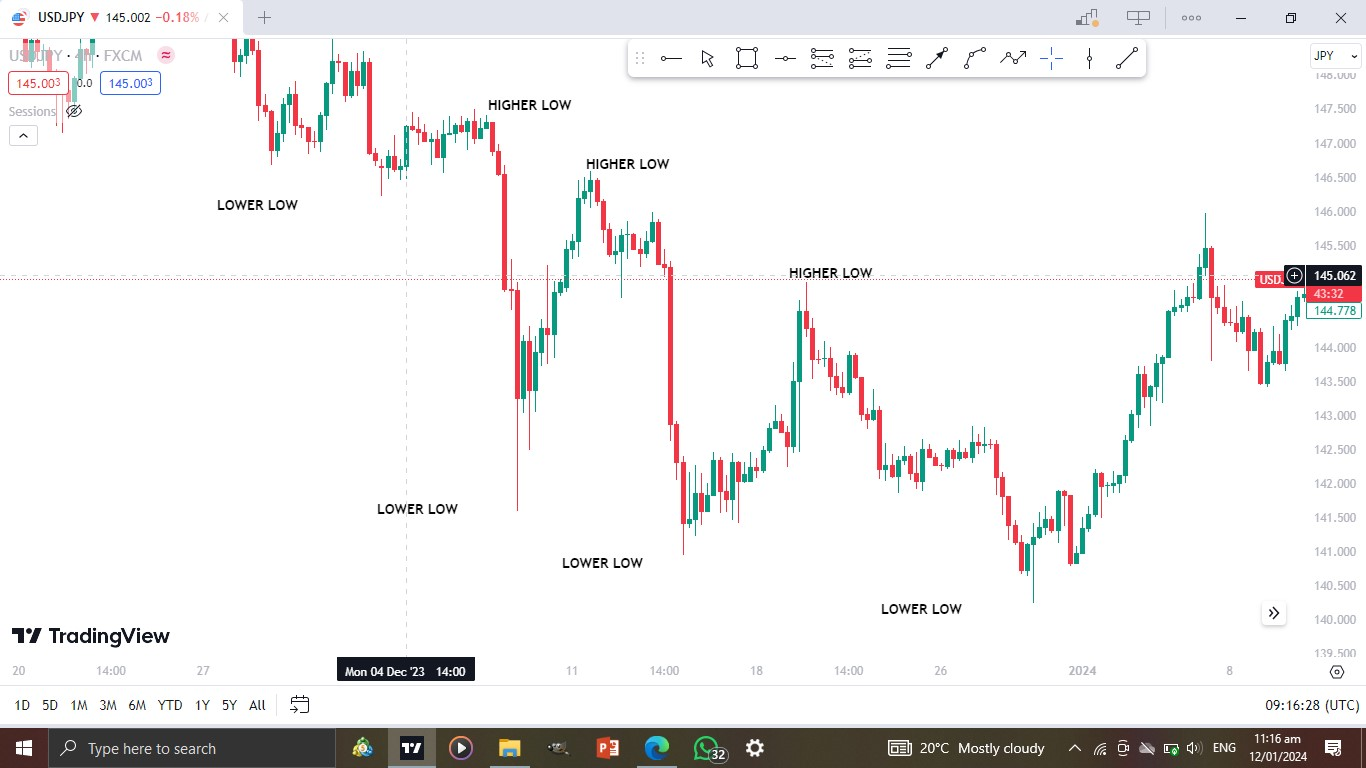
CHART EXAMPLE OF A BEARISH MARKET
USD/JPY 4HR Time Frame
Sideways
Sideways (or chop) markets are characterized by indecisive price action, low trading volumes, and a choppy and uncertain character. They can be challenging for traders and investors who need to use range-bound strategies such as buying at support levels and selling at resistance levels. Technical indicators and fundamental analysis can provide insight into the market's underlying conditions and potential catalysts for a breakout. Overall, trading in a sideways market requires patience, discipline, and a well-defined strategy.
The sideways market makes equal lows and equal highs
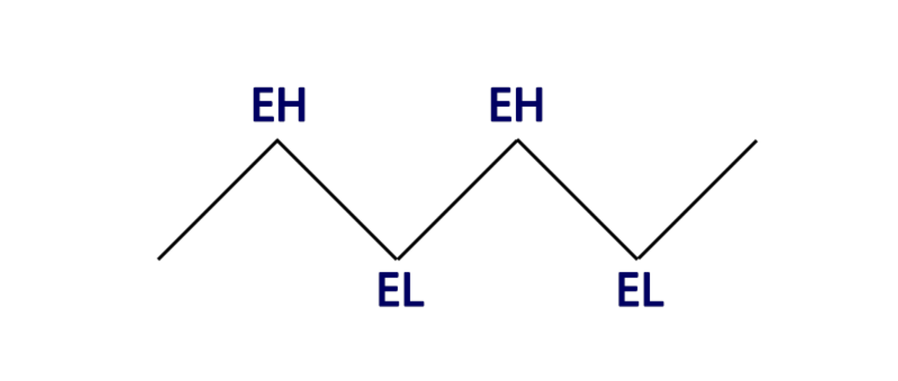
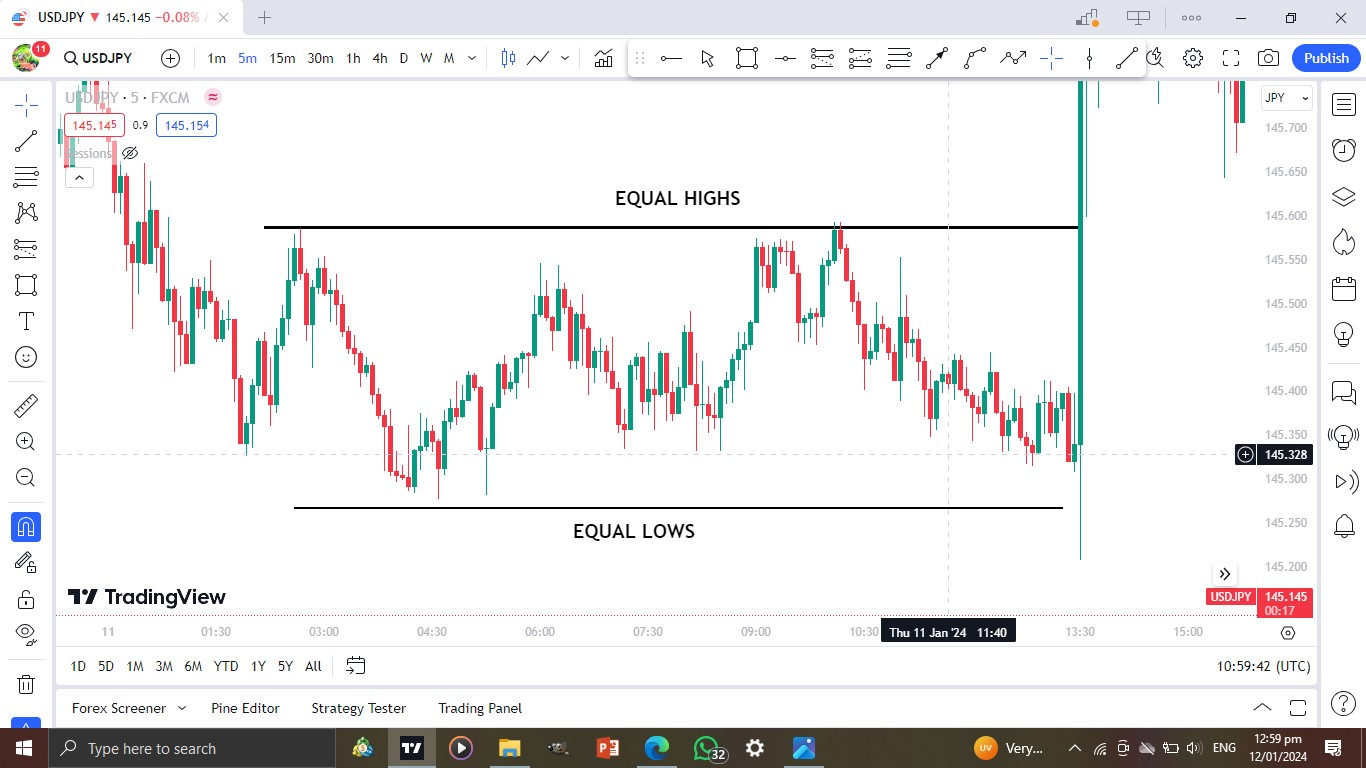
CHART EXAMPLE OF A SIDEWAYS MARKERT
NOTE: Markets are not always picture perfect sometimes you would have to look harder to see the current market structure, But always keep things simple.
TYPES OR PRICE CHARTS
There are a number of charts which traders use todo there technical analysis but the mst common ones are
- Candle stick chart
- Line chart
- Bar Chart
Below are examples of the same asset but different chart type
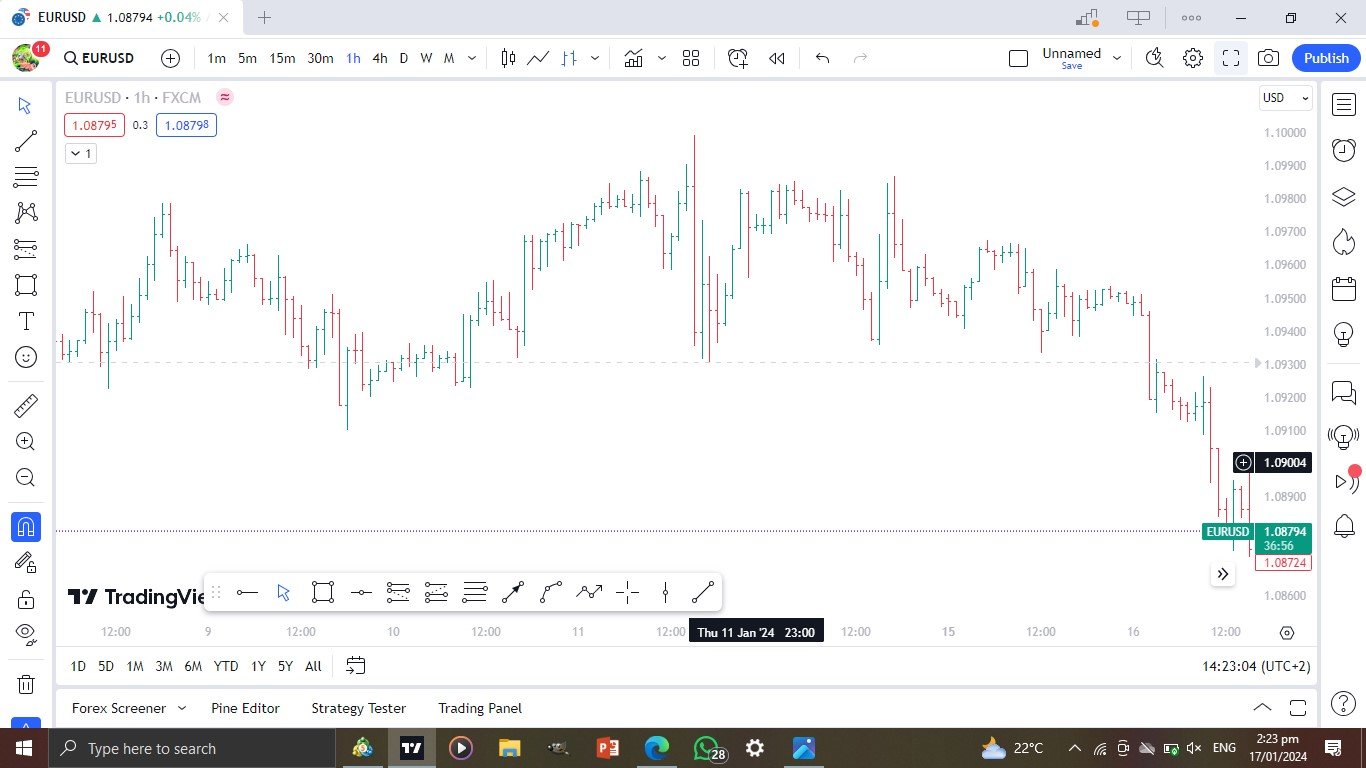
Candle stick chart
Candle stick chart uses candle sticks to show the activity of an asses ast a given time.
Line Chart
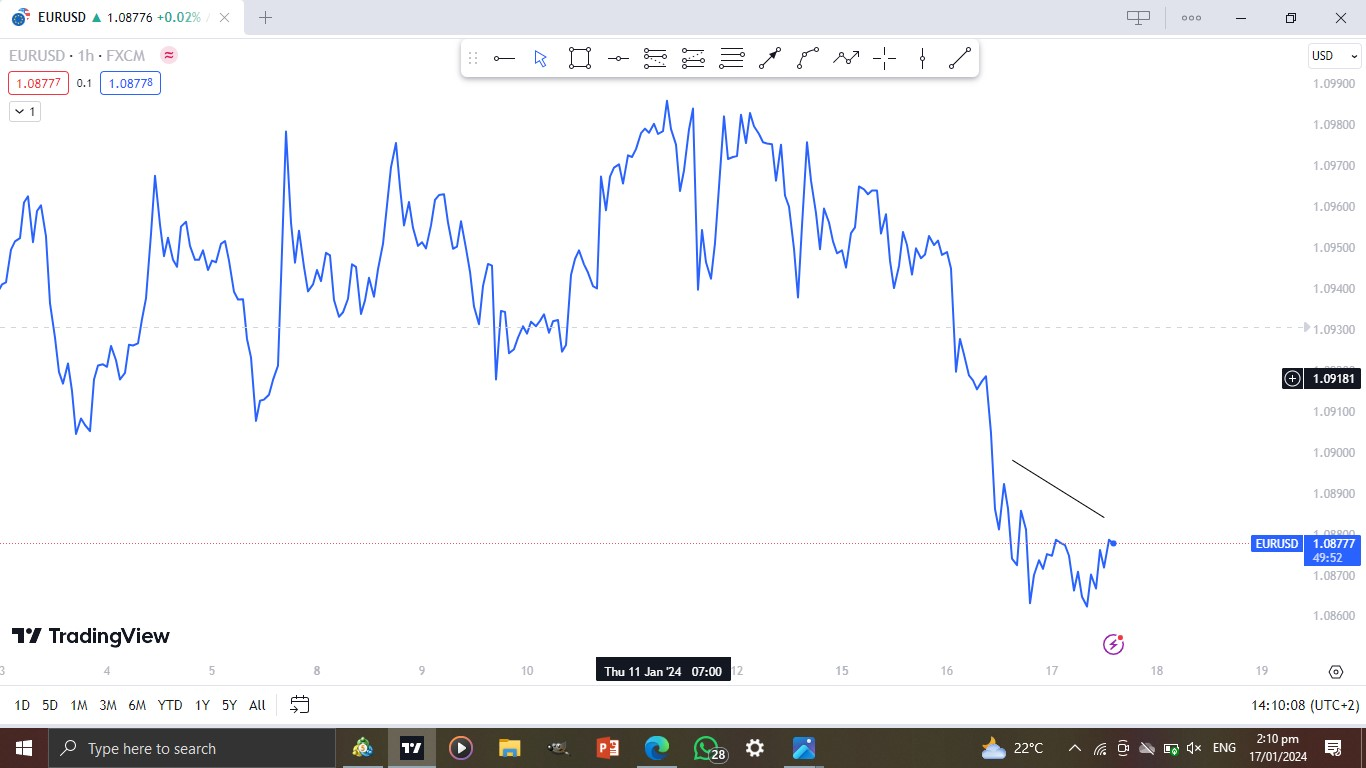
Lin.e chart uses lines to show the activity of an asses at a given time.
Bar chart
Bar chart uses bars to show the activity of an asses at a given time.
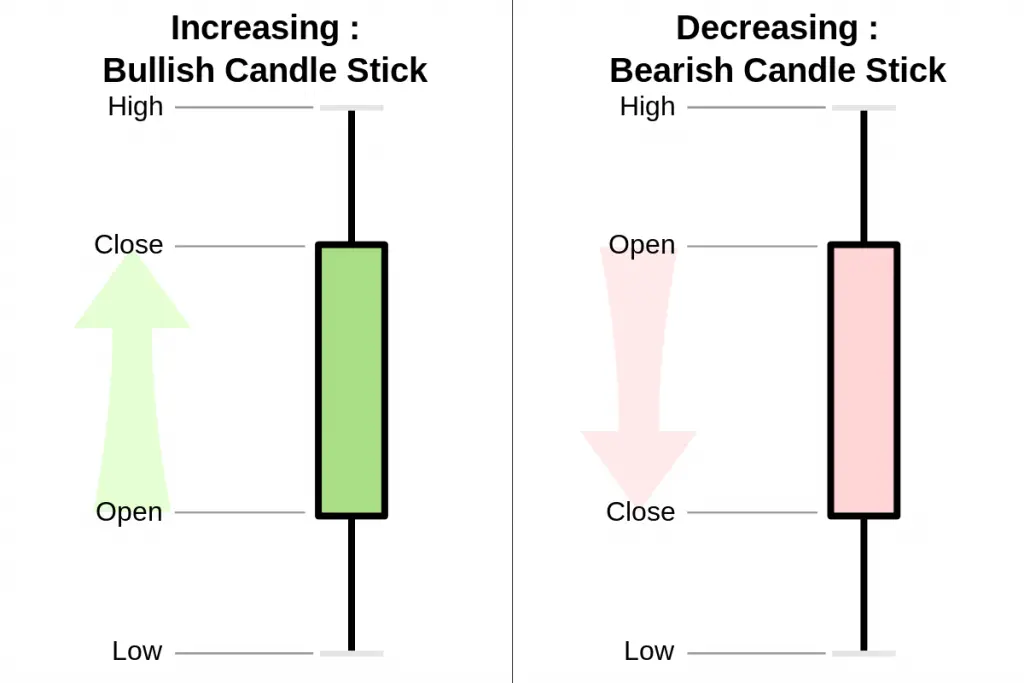
CANDLESTICK CHARTS
Candlestick charts are widely used in technical analysis of stocks, bonds, commodities, and other financial instruments. They are useful in identifying trends, patterns, and potential reversals in the market.
The chart displays the open, high, low, and close price for a given period of time, typically a day or week.
The body of the candlestick represents the difference between the open and close price, and the wicks or shadows represent the high and low of the day. The color of the candlestick can indicate whether the price closed higher or lower than the open, with green or white indicating a higher close and red or black indicating a lower close. By analyzing candlestick patterns and formations, traders can make more informed decisions about buying or selling a security.
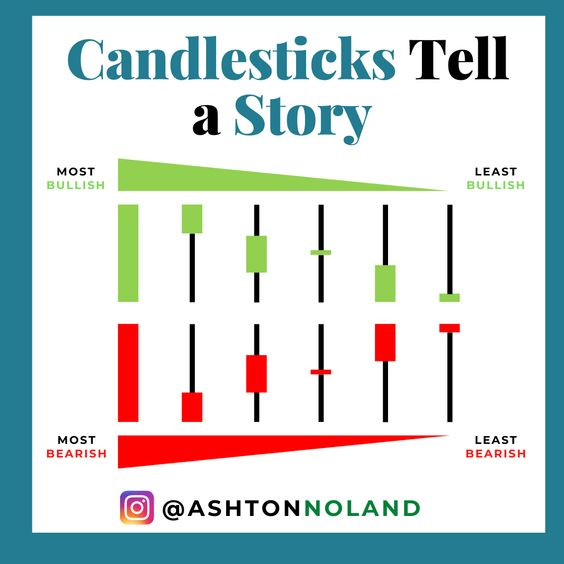
Candlesticks on a chart give us a peak directly behind the curtain of human psychology, thus in turn, a story as to what the stock may be doing in the near future. There are a lot of variations of a candlestick but mastering how these bullish and bearish candles dictatate current and future trends can be a key weapon in your trading/investing arsenal
SMART MONEY CONCEPTS
LIQUIDITY
Forex is considered the most liquid market in the world due to the high volume and frequency with which it’s traded. So in the forex market, liquity is simply market orders that have been placed by traders. Areas of high liquidity are those areas where alot of traders placed there orders. The reason for these orders is that traders anticipate the market to move in a certain direction hence they put on orders.
Liquidity zones are specific price levvels where significant levels f liquidity can be found. they often act as areas of support and resistance.
Types or liquidity
- . Support and resistance. Prices move because of supply and demand. When demand is greater than supply, prices rise. When supply is greater than demand, prices fall. Sometimes, prices will move sideways as both supply and demand are in equilibrium.
KEY: When price is near demand(support) zone is rises and when price is near a supply(resistance) zone it drops. At a support and resistance zone there is liquidity because traders begin to buy and sell by opening market orders.
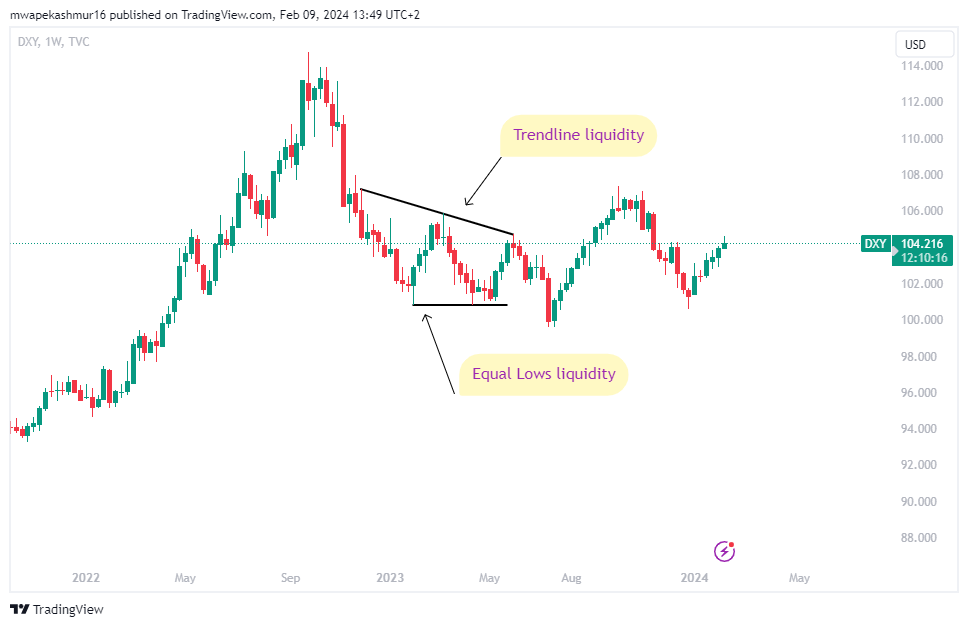
2. Trendline Liquidity. A trendline is diagonal line that price has touched at least three times. Where a trendline is formed, traders tend to put orders so that they can make profits, as they go with the trend. Over time the trendline becomes liquidity because orders have been placed there.
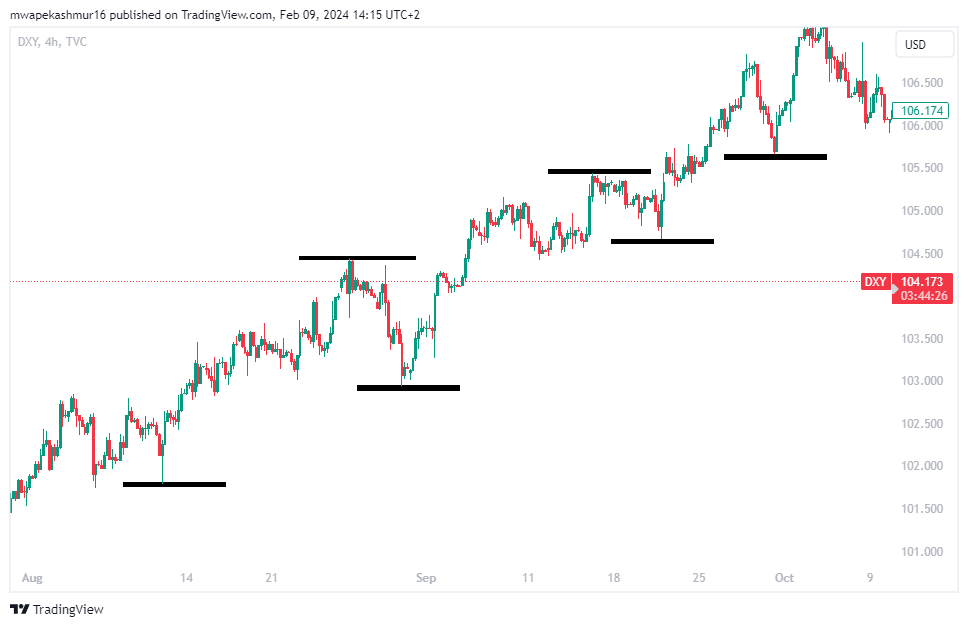
3. EQUAL LOWS AND EQUAL HIGHS. Equal lows and Equal highs are also know as double bottoms and double tops or tripple tops and tripple bottoms
Your paragraph text
Equal highs liquidity
Equal lows liquiditys
SMC RANGE
A range is made up of three components.
1. Strong high and Strong low
2. Liquidity
3. Point of interest
#STRONG LOW/STRONG HIGH
-A market range is confirmed by a strong low or a strong high. A strong high/low must have;
1. Run of liquidity (liquidity grab)
2. A break of structure (When price closes below or above structure point)
-when market crates a SMC RANGE. there will be a strong high and a strong low.